Advanced Search: Build a Custom Dashboard
In the fields below, search for indicators by location, topics, population, classification, subgroup, or comparison. No fields are required, but we suggest selecting a location or two to start. In the additional search options section, select options to group and order search results. To learn more about how to customize a dashboard, see our help center.
Visit the Indicator List Page to see the full list of indicators and locations available on the site.
Search Results:
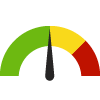
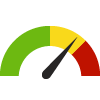
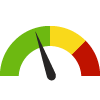
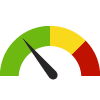
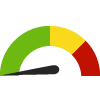
Indicator Gauge Icon Legend
Legend Colors
Red is bad, green is good, blue is not statistically different/neutral.
Compared to Distribution
 the value is in the best half of communities.
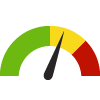 the value is in the 2nd worst quarter of communities.
 the value is in the worst quarter of communities.
Compared to Target
 meets target;
  does not meet target.
Compared to a Single Value
 lower than the comparison value;
 higher than the comparison value;
 not statistically different from comparison value.
Trend

 non-significant change over time;
 significant change over time;
  no change over time.
Compared to Prior Value
 higher than the previous measurement period;
 lower than the previous measurement period;
 no statistically different change from previous measurement period.
Health
Health
County: Morris
Value
Compared to:
County: Morris Age-Adjusted Years of Potential Life Lost
County: Morris Age-Adjusted Years of Potential Life Lost
5,614.7
Years per 100,000 Population
(2015)
Compared to:


Prior Value
(5,269.9)
Prior Value compares a measured value with the previously measured value. Confidence intervals were taken into account in determining the direction of the comparison.
Trend
This comparison measures the indicator’s values over multiple time periods.<br>The Mann-Kendall Test for Statistical Significance is used to evaluate the trend<br>over 4 to 10 periods of measure, subject to data availability and comparability.
Health / Alcohol & Drug Use
Health / Alcohol & Drug Use
County: Morris
Value
Compared to:
County: Morris Adults who Binge Drink
County: Morris Adults who Binge Drink
16.1%
(2021)
Compared to:

NJ Counties
The distribution is based on data from 21 New Jersey counties.
NJ Value
(15.7%)
The regional value is compared to the New Jersey State value.
US Value
(15.4%)
The regional value is compared to the national value. The source for the national value is Behavioral Risk Factor Surveillance System
Prior Value
(13.8%)
Prior Value compares a measured value with the previously measured value. Confidence intervals were taken into account in determining the direction of the comparison.
Trend
This comparison measures the indicator’s values over multiple time periods.<br>The Mann-Kendall Test for Statistical Significance is used to evaluate the trend<br>over 4 to 10 periods of measure, subject to data availability and comparability.
County: Morris Adults who Drink Excessively
County: Morris Adults who Drink Excessively
18.5%
(2021)
Compared to:

NJ Counties
The distribution is based on data from 21 New Jersey counties.
U.S. Counties
The distribution is based on data from 3,141 U.S. counties and county equivalents.
NJ Value
(16.8%)
The regional value is compared to the New Jersey State value.
US Value
(18.1%)
The regional value is compared to the national value.
Prior Value
(20.0%)
Prior Value compares a measured value with the previously measured value. Confidence intervals were taken into account in determining the direction of the comparison.
County: Morris Adults who Use Alcohol: Past 30 Days
County: Morris Adults who Use Alcohol: Past 30 Days
69.4%
(2021)
Compared to:
NJ Counties
The distribution is based on data from 21 New Jersey counties.
NJ Value
(56.8%)
The regional value is compared to the New Jersey State value.
Prior Value
(62.6%)
Prior Value compares a measured value with the previously measured value. Confidence intervals were taken into account in determining the direction of the comparison.
Trend
This comparison measures the indicator’s values over multiple time periods.<br>The Mann-Kendall Test for Statistical Significance is used to evaluate the trend<br>over 4 to 10 periods of measure, subject to data availability and comparability.
County: Morris Age-Adjusted Drug and Opioid-Involved Overdose Death Rate
County: Morris Age-Adjusted Drug and Opioid-Involved Overdose Death Rate
21.2
Deaths per 100,000 population
(2018-2020)
Compared to:
NJ Counties
The distribution is based on data from 21 New Jersey counties.
U.S. Counties
The distribution is based on data from 1,303 U.S. counties and county equivalents.
NJ Value
(32.3)
The regional value is compared to the New Jersey State value.
US Value
(23.5)
The regional value is compared to the national value.
Prior Value
(22.2)
Prior Value compares a measured value with the previously measured value. Confidence intervals were taken into account in determining the direction of the comparison.
14.1
Age-Adjusted Rate per 10,000 population
(2014)
Compared to:
NJ Value
(25.56)
The regional value is compared to the average rate for New Jersey Counties.
Prior Value
(19.5)
Prior Value compares a measured value with the previously measured value. Confidence intervals were not taken into account in determining the direction of the comparison.
County: Morris Death Rate due to Drug Poisoning
County: Morris Death Rate due to Drug Poisoning
19.9
Deaths per 100,000 population
(2019-2021)
Compared to:
NJ Counties
The distribution is based on data from 21 New Jersey counties.
U.S. Counties
The distribution is based on data from 1,899 U.S. counties and county equivalents.
NJ Value
(32.2)
The regional value is compared to the New Jersey State value.
US Value
(27.2)
The regional value is compared to the national value.
HP 2030 Target
(20.7)
<div>SU-03: Reduce drug overdose deaths <strong>(LEADING HEALTH INDICATOR)</strong></div>
County: Morris Opioid Treatment Admission Rate
County: Morris Opioid Treatment Admission Rate
133.6
Admissions per 100,000 population
(2022)
Compared to:
NJ Counties
The distribution is based on data from 21 New Jersey counties.
NJ Value
(404.7)
The regional value is compared to the New Jersey State value.
Prior Value
(188.5)
Prior Value compares a measured value with the previously measured value. Confidence intervals were not taken into account in determining the direction of the comparison.
Trend
This comparison measures the indicator’s values over multiple time periods.<br>The Mann-Kendall Test for Statistical Significance is used to evaluate the trend<br>over 4 to 10 periods of measure, subject to data availability and comparability.
Health / Cancer
Health / Cancer
County: Morris
Value
Compared to:
County: Morris Adults with Cancer
County: Morris Adults with Cancer
7.2%
(2021)
Compared to:

NJ Counties
The distribution is based on data from 21 New Jersey counties.
U.S. Counties
The distribution is based on data from 3,074 U.S. counties and county equivalents.
US Value
(7.0%)
The regional value is compared to the national value.
County: Morris Adults with Cancer (Non-Skin) or Melanoma
County: Morris Adults with Cancer (Non-Skin) or Melanoma
8.5%
(2022)
Compared to:
NJ Counties
The distribution is based on data from 21 New Jersey counties.
U.S. Counties
The distribution is based on data from 3,133 U.S. counties and county equivalents.
US Value
(8.2%)
The regional value is compared to the national value.
County: Morris Age-Adjusted Death Rate due to Breast Cancer
County: Morris Age-Adjusted Death Rate due to Breast Cancer
17.8
Deaths per 100,000 females
(2018-2022)
Compared to:
NJ Counties
The distribution is based on data from 21 New Jersey counties.
U.S. Counties
The distribution is based on data from 1,778 U.S. counties and county equivalents.
NJ Value
(19.1)
The regional value is compared to the New Jersey State value.
US Value
(19.3)
The regional value is compared to the national value.
Prior Value
(18.3)
Prior Value compares a measured value with the previously measured value. Confidence intervals were taken into account in determining the direction of the comparison.
Trend
This comparison measures the indicator’s values over multiple time periods.<br>The Mann-Kendall Test for Statistical Significance is used to evaluate the trend<br>over 4 to 10 periods of measure, subject to data availability and comparability.
HP 2030 Target
(15.3)
NJ 2020
(23.5)
<div><span>According to the American Cancer Society, breast cancer is the second leading cause of cancer death and the second most common type of cancer among women in the U.S. The greatest risk factor in developing breast cancer is age. Since 1990, breast cancer death rates have declined progressively due to advancements in treatment and detection.</span></div>
County: Morris Age-Adjusted Death Rate due to Cancer
County: Morris Age-Adjusted Death Rate due to Cancer
119.6
Deaths per 100,000 population
(2018-2022)
Compared to:
NJ Counties
The distribution is based on data from 21 New Jersey counties.
U.S. Counties
The distribution is based on data from 3,080 U.S. counties and county equivalents.
NJ Value
(131.6)
The regional value is compared to the New Jersey State value.
US Value
(146.0)
The regional value is compared to the national value.
Prior Value
(128.9)
Prior Value compares a measured value with the previously measured value. Confidence intervals were taken into account in determining the direction of the comparison.
Trend
This comparison measures the indicator’s values over multiple time periods.<br>The Mann-Kendall Test for Statistical Significance is used to evaluate the trend<br>over 4 to 10 periods of measure, subject to data availability and comparability.
HP 2030 Target
(122.7)
NJ 2020
(161.5)
County: Morris Age-Adjusted Death Rate due to Colorectal Cancer
County: Morris Age-Adjusted Death Rate due to Colorectal Cancer
9.8
Deaths per 100,000 population
(2018-2022)
Compared to:
NJ Counties
The distribution is based on data from 21 New Jersey counties.
U.S. Counties
The distribution is based on data from 2,180 U.S. counties and county equivalents.
NJ Value
(11.8)
The regional value is compared to the New Jersey State value.
US Value
(12.9)
The regional value is compared to the national value.
Prior Value
(11.3)
Prior Value compares a measured value with the previously measured value. Confidence intervals were taken into account in determining the direction of the comparison.
Trend
This comparison measures the indicator’s values over multiple time periods.<br>The Mann-Kendall Test for Statistical Significance is used to evaluate the trend<br>over 4 to 10 periods of measure, subject to data availability and comparability.
HP 2030 Target
(8.9)
NJ 2020
(15.8)
<div><span>Colorectal cancer--cancer of the colon or rectum--is the second leading cause of cancer-related deaths in the United States. The Centers for Disease Control and Prevention estimates that if all adults aged 50 or older had regular screening tests for colon cancer, as many as 60% of the deaths from colorectal cancer could be prevented. While 90% of colorectal cancer cases occur in adults aged 50 or older, it is essential for individuals with risk factors (those with a family history of colorectal cancer, inflammatory bowel disease, or heavy alcohol use) to seek regular screening earlier.</span></div>
County: Morris Age-Adjusted Death Rate due to Lung Cancer
County: Morris Age-Adjusted Death Rate due to Lung Cancer
22.4
Deaths per 100,000 population
(2018-2022)
Compared to:
NJ Counties
The distribution is based on data from 21 New Jersey counties.
U.S. Counties
The distribution is based on data from 2,746 U.S. counties and county equivalents.
NJ Value
(26.8)
The regional value is compared to the New Jersey State value.
US Value
(32.4)
The regional value is compared to the national value.
Prior Value
(26.0)
Prior Value compares a measured value with the previously measured value. Confidence intervals were taken into account in determining the direction of the comparison.
Trend
This comparison measures the indicator’s values over multiple time periods.<br>The Mann-Kendall Test for Statistical Significance is used to evaluate the trend<br>over 4 to 10 periods of measure, subject to data availability and comparability.
HP 2030 Target
(25.1)
NJ 2020
(42.0)
<div><span>According to the American Lung Association, more people die from lung cancer annually than any other type of cancer, exceeding the total deaths caused by breast cancer, colorectal cancer, and prostate cancer combined. The greatest risk factor for lung cancer is duration and quantity of smoking. While the mortality rate due to lung cancer among men has reached a plateau, the mortality rate due to lung cancer among women continues to increase.</span></div>
County: Morris Age-Adjusted Death Rate due to Pancreatic Cancer
County: Morris Age-Adjusted Death Rate due to Pancreatic Cancer
11.2
Deaths per 100,000 population
(2018-2022)
Compared to:
NJ Counties
The distribution is based on data from 21 New Jersey counties.
U.S. Counties
The distribution is based on data from 1,892 U.S. counties and county equivalents.
NJ Value
(11.2)
The regional value is compared to the New Jersey State value.
US Value
(11.2)
The regional value is compared to the national value.
Prior Value
(11.8)
Prior Value compares a measured value with the previously measured value. Confidence intervals were taken into account in determining the direction of the comparison.
Trend
This comparison measures the indicator’s values over multiple time periods.<br>The Mann-Kendall Test for Statistical Significance is used to evaluate the trend<br>over 4 to 10 periods of measure, subject to data availability and comparability.
County: Morris Age-Adjusted Death Rate due to Prostate Cancer
County: Morris Age-Adjusted Death Rate due to Prostate Cancer
14.8
Deaths per 100,000 males
(2018-2022)
Compared to:
U.S. Counties
The distribution is based on data from 1,612 U.S. counties and county equivalents.
NJ Value
(16.3)
The regional value is compared to the New Jersey State value.
US Value
(19.0)
The regional value is compared to the national value.
Prior Value
(14.3)
Prior Value compares a measured value with the previously measured value. Confidence intervals were taken into account in determining the direction of the comparison.
Trend
This comparison measures the indicator’s values over multiple time periods.<br>The Mann-Kendall Test for Statistical Significance is used to evaluate the trend<br>over 4 to 10 periods of measure, subject to data availability and comparability.
HP 2030 Target
(16.9)
NJ 2020
(21.2)
<div><span>According to the American Cancer Society, prostate cancer is the most commonly diagnosed form of cancer among men in the United States and it is second only to lung cancer as a cause of cancer-related death among men. The two greatest risk factors for prostate cancer are age and race/ethnicity, with men over the age of 65 and men of African descent possessing the highest incidence rates of prostate cancer in the U.S.</span></div>
County: Morris All Cancer Incidence Rate
County: Morris All Cancer Incidence Rate
469.0
Cases per 100,000 population
(2017-2021)
Compared to:
NJ Counties
The distribution is based on data from 21 New Jersey counties.
U.S. Counties
The distribution is based on data from 2,931 U.S. counties and county equivalents.
NJ Value
(473.6)
The regional value is compared to the New Jersey State value.
US Value
(444.4)
The regional value is compared to the national value.
Prior Value
(484.4)
Prior Value compares a measured value with the previously measured value. Confidence intervals were taken into account in determining the direction of the comparison.
Trend
This comparison measures the indicator’s values over multiple time periods.<br>The Mann-Kendall Test for Statistical Significance is used to evaluate the trend<br>over 4 to 10 periods of measure, subject to data availability and comparability.
County: Morris Breast Cancer Incidence Rate
County: Morris Breast Cancer Incidence Rate
144.3
Cases per 100,000 females
(2017-2021)
Compared to:

NJ Counties
The distribution is based on data from 21 New Jersey counties.
U.S. Counties
The distribution is based on data from 2,712 U.S. counties and county equivalents.
NJ Value
(136.4)
The regional value is compared to the New Jersey State value.
US Value
(129.8)
The regional value is compared to the national value.
Prior Value
(146.7)
Prior Value compares a measured value with the previously measured value. Confidence intervals were taken into account in determining the direction of the comparison.
Trend
This comparison measures the indicator’s values over multiple time periods.<br>The Mann-Kendall Test for Statistical Significance is used to evaluate the trend<br>over 4 to 10 periods of measure, subject to data availability and comparability.
County: Morris Cancer: Medicare Population
County: Morris Cancer: Medicare Population
14.0%
(2022)
Compared to:
NJ Counties
The distribution is based on data from 21 New Jersey counties.
U.S. Counties
The distribution is based on data from 3,129 U.S. counties and county equivalents.
NJ Value
(13.0%)
The regional value is compared to the New Jersey State value.
US Value
(12.0%)
The regional value is compared to the national value.
Prior Value
(13.0%)
Prior Value compares a measured value with the previously measured value. Confidence intervals were not taken into account in determining the direction of the comparison.
Trend
This comparison measures the indicator’s values over multiple time periods.<br>The Mann-Kendall Test for Statistical Significance is used to evaluate the trend<br>over 4 to 10 periods of measure, subject to data availability and comparability.
County: Morris Cervical Cancer Incidence Rate
County: Morris Cervical Cancer Incidence Rate
7.2
Cases per 100,000 females
(2017-2021)
Compared to:
NJ Counties
The distribution is based on data from 20 New Jersey counties.
U.S. Counties
The distribution is based on data from 727 U.S. counties and county equivalents.
NJ Value
(7.2)
The regional value is compared to the New Jersey State value.
US Value
(7.5)
The regional value is compared to the national value.
Prior Value
(6.7)
Prior Value compares a measured value with the previously measured value. Confidence intervals were taken into account in determining the direction of the comparison.
Trend
This comparison measures the indicator’s values over multiple time periods.<br>The Mann-Kendall Test for Statistical Significance is used to evaluate the trend<br>over 4 to 10 periods of measure, subject to data availability and comparability.
NJ 2020
(7.2)
<div><span>Cervical cancer forms in tissues of the cervix. One out of every 145 women in the United States will be diagnosed in their lifetime. Early cervical cancer can be cured by removing or destroying the pre-cancerous or cancerous tissue. Human papillomavirus (HPV), which is transmitted through sexual contact, has been identified as the main cause of cervical cancer. In 2006, the FDA approved a new vaccine against HPV which prevents cervical cancer. In the United States in 2009, it is estimated that there were 11,270 new cases and 4,070 deaths from cervical cancer.</span></div>
County: Morris Cervical Cancer Screening: 21-65
County: Morris Cervical Cancer Screening: 21-65
84.1%
(2020)
Compared to:
NJ Counties
The distribution is based on data from 21 New Jersey counties.
U.S. Counties
The distribution is based on data from 3,141 U.S. counties and county equivalents.
US Value
(82.8%)
The regional value is compared to the national value.
County: Morris Colon Cancer Screening: USPSTF Recommendation
County: Morris Colon Cancer Screening: USPSTF Recommendation
68.8%
(2022)
Compared to:
NJ Counties
The distribution is based on data from 21 New Jersey counties.
U.S. Counties
The distribution is based on data from 3,133 U.S. counties and county equivalents.
US Value
(66.3%)
The regional value is compared to the national value.
County: Morris Colorectal Cancer Incidence Rate
County: Morris Colorectal Cancer Incidence Rate
35.1
Cases per 100,000 population
(2017-2021)
Compared to:
NJ Counties
The distribution is based on data from 21 New Jersey counties.
U.S. Counties
The distribution is based on data from 2,613 U.S. counties and county equivalents.
NJ Value
(37.9)
The regional value is compared to the New Jersey State value.
US Value
(36.4)
The regional value is compared to the national value.
Prior Value
(36.5)
Prior Value compares a measured value with the previously measured value. Confidence intervals were taken into account in determining the direction of the comparison.
Trend
This comparison measures the indicator’s values over multiple time periods.<br>The Mann-Kendall Test for Statistical Significance is used to evaluate the trend<br>over 4 to 10 periods of measure, subject to data availability and comparability.
NJ 2020
(39.7)
<div><span>Colorectal cancer--cancer of the colon or rectum--is the second leading cause of cancer-related deaths in the United States. If adults aged 50 or older had regular screening tests, as many as 60% of the deaths from colorectal cancer could be prevented. In the U.S. in 2009, it is estimated that there were 106,100 new cases and 49,920 deaths from colorectal cancer.</span></div>
County: Morris Liver and Bile Duct Cancer Incidence Rate
County: Morris Liver and Bile Duct Cancer Incidence Rate
6.5
Cases per 100,000 population
(2017-2021)
Compared to:
NJ Counties
The distribution is based on data from 21 New Jersey counties.
U.S. Counties
The distribution is based on data from 1,491 U.S. counties and county equivalents.
NJ Value
(7.9)
The regional value is compared to the New Jersey State value.
US Value
(8.6)
The regional value is compared to the national value.
Prior Value
(7.0)
Prior Value compares a measured value with the previously measured value. Confidence intervals were taken into account in determining the direction of the comparison.
Trend
This comparison measures the indicator’s values over multiple time periods.<br>The Mann-Kendall Test for Statistical Significance is used to evaluate the trend<br>over 4 to 10 periods of measure, subject to data availability and comparability.
County: Morris Lung and Bronchus Cancer Incidence Rate
County: Morris Lung and Bronchus Cancer Incidence Rate
41.7
Cases per 100,000 population
(2017-2021)
Compared to:
NJ Counties
The distribution is based on data from 21 New Jersey counties.
U.S. Counties
The distribution is based on data from 2,711 U.S. counties and county equivalents.
NJ Value
(49.1)
The regional value is compared to the New Jersey State value.
US Value
(53.1)
The regional value is compared to the national value.
Prior Value
(44.4)
Prior Value compares a measured value with the previously measured value. Confidence intervals were taken into account in determining the direction of the comparison.
Trend
This comparison measures the indicator’s values over multiple time periods.<br>The Mann-Kendall Test for Statistical Significance is used to evaluate the trend<br>over 4 to 10 periods of measure, subject to data availability and comparability.
County: Morris Mammogram in Past 2 Years: 50-74
County: Morris Mammogram in Past 2 Years: 50-74
71.2%
(2021)
Compared to:


NJ Counties
(2017)
The distribution is based on data from 21 New Jersey counties.
NJ Value
(73.3%)
The regional value is compared to the New Jersey State value.
US Value
(76.3% in 2022)
The regional value is compared to the national value. The source for the national value is Behavioral Risk Factor Surveillance System
Prior Value
(84.4%)
Prior Value compares a measured value with the previously measured value. Confidence intervals were taken into account in determining the direction of the comparison.
Trend
This comparison measures the indicator’s values over multiple time periods.<br>The Mann-Kendall Test for Statistical Significance is used to evaluate the trend<br>over 4 to 10 periods of measure, subject to data availability and comparability.
HP 2030 Target
(80.3%)
County: Morris Mammography Screening: Medicare Population
County: Morris Mammography Screening: Medicare Population
47.0%
(2022)
Compared to:
NJ Counties
The distribution is based on data from 21 New Jersey counties.
U.S. Counties
The distribution is based on data from 3,123 U.S. counties and county equivalents.
NJ Value
(45.0%)
The regional value is compared to the New Jersey State value.
US Value
(47.0%)
The regional value is compared to the national value.
Prior Value
(46.0%)
Prior Value compares a measured value with the previously measured value. Confidence intervals were not taken into account in determining the direction of the comparison.
Trend
This comparison measures the indicator’s values over multiple time periods.<br>The Mann-Kendall Test for Statistical Significance is used to evaluate the trend<br>over 4 to 10 periods of measure, subject to data availability and comparability.
County: Morris Melanoma Incidence Rate
County: Morris Melanoma Incidence Rate
25.2
Cases per 100,000 population
(2017-2021)
Compared to:
NJ Counties
The distribution is based on data from 21 New Jersey counties.
U.S. Counties
The distribution is based on data from 2,182 U.S. counties and county equivalents.
NJ Value
(20.7)
The regional value is compared to the New Jersey State value.
US Value
(22.7)
The regional value is compared to the national value.
Prior Value
(26.1)
Prior Value compares a measured value with the previously measured value. Confidence intervals were taken into account in determining the direction of the comparison.
Trend
This comparison measures the indicator’s values over multiple time periods.<br>The Mann-Kendall Test for Statistical Significance is used to evaluate the trend<br>over 4 to 10 periods of measure, subject to data availability and comparability.
County: Morris Non-Hodgkin Lymphoma Incidence Rate
County: Morris Non-Hodgkin Lymphoma Incidence Rate
22.6
Cases per 100,000 population
(2017-2021)
Compared to:
NJ Counties
The distribution is based on data from 21 New Jersey counties.
U.S. Counties
The distribution is based on data from 2,077 U.S. counties and county equivalents.
NJ Value
(20.8)
The regional value is compared to the New Jersey State value.
US Value
(18.5)
The regional value is compared to the national value.
Prior Value
(23.6)
Prior Value compares a measured value with the previously measured value. Confidence intervals were taken into account in determining the direction of the comparison.
Trend
This comparison measures the indicator’s values over multiple time periods.<br>The Mann-Kendall Test for Statistical Significance is used to evaluate the trend<br>over 4 to 10 periods of measure, subject to data availability and comparability.
County: Morris Oral Cavity and Pharynx Cancer Incidence Rate
County: Morris Oral Cavity and Pharynx Cancer Incidence Rate
11.1
Cases per 100,000 population
(2017-2021)
Compared to:
NJ Counties
The distribution is based on data from 21 New Jersey counties.
U.S. Counties
The distribution is based on data from 1,869 U.S. counties and county equivalents.
NJ Value
(11.2)
The regional value is compared to the New Jersey State value.
US Value
(12.0)
The regional value is compared to the national value.
Prior Value
(11.4)
Prior Value compares a measured value with the previously measured value. Confidence intervals were taken into account in determining the direction of the comparison.
Trend
This comparison measures the indicator’s values over multiple time periods.<br>The Mann-Kendall Test for Statistical Significance is used to evaluate the trend<br>over 4 to 10 periods of measure, subject to data availability and comparability.
County: Morris Pancreatic Cancer Incidence Rate
County: Morris Pancreatic Cancer Incidence Rate
14.6
Cases per 100,000 population
(2017-2021)
Compared to:
NJ Counties
The distribution is based on data from 21 New Jersey counties.
U.S. Counties
The distribution is based on data from 1,917 U.S. counties and county equivalents.
NJ Value
(15.0)
The regional value is compared to the New Jersey State value.
US Value
(13.5)
The regional value is compared to the national value.
Prior Value
(15.2)
Prior Value compares a measured value with the previously measured value. Confidence intervals were taken into account in determining the direction of the comparison.
Trend
This comparison measures the indicator’s values over multiple time periods.<br>The Mann-Kendall Test for Statistical Significance is used to evaluate the trend<br>over 4 to 10 periods of measure, subject to data availability and comparability.
County: Morris Pap Test in Past 3 Years: 21-65
County: Morris Pap Test in Past 3 Years: 21-65
79.8%
(2020)
Compared to:

NJ Counties
(2017)
The distribution is based on data from 21 New Jersey counties.
NJ Value
(80.0%)
The regional value is compared to the New Jersey State value.
US Value
(77.7%)
The regional value is compared to the national value. The source for the national value is Behavioral Risk Factor Surveillance System
Prior Value
(76.1%)
Prior Value compares a measured value with the previously measured value. Confidence intervals were taken into account in determining the direction of the comparison.
Trend
This comparison measures the indicator’s values over multiple time periods.<br>The Mann-Kendall Test for Statistical Significance is used to evaluate the trend<br>over 4 to 10 periods of measure, subject to data availability and comparability.
County: Morris Prostate Cancer Incidence Rate
County: Morris Prostate Cancer Incidence Rate
140.5
Cases per 100,000 males
(2017-2021)
Compared to:
NJ Counties
The distribution is based on data from 21 New Jersey counties.
U.S. Counties
The distribution is based on data from 2,728 U.S. counties and county equivalents.
NJ Value
(142.6)
The regional value is compared to the New Jersey State value.
US Value
(113.2)
The regional value is compared to the national value.
Prior Value
(142.4)
Prior Value compares a measured value with the previously measured value. Confidence intervals were taken into account in determining the direction of the comparison.
Trend
This comparison measures the indicator’s values over multiple time periods.<br>The Mann-Kendall Test for Statistical Significance is used to evaluate the trend<br>over 4 to 10 periods of measure, subject to data availability and comparability.
Health / Children's Health
Health / Children's Health
County: Morris
Value
Compared to:
County: Morris Child Mortality Rate: Under 20
County: Morris Child Mortality Rate: Under 20
21.6
Deaths per 100,000 population under 20
(2018-2021)
Compared to:
NJ Counties
The distribution is based on data from 21 New Jersey counties.
U.S. Counties
The distribution is based on data from 2,859 U.S. counties and county equivalents. Counties in Idaho, Kentucky, and Oklahoma are excluded due to incomparable data between each other and the rest of the country.
NJ Value
(34.1)
The regional value is compared to the New Jersey State value.
US Value
(50.6)
The regional value is compared to the national value.
Health / County Health Rankings
Health / County Health Rankings
County: Morris
Value
Compared to:
County: Morris Clinical Care Ranking
County: Morris Clinical Care Ranking
2
(2023)
Compared to:
NJ Counties
The distribution is based on data from 21 New Jersey counties.
County: Morris Health Behaviors Ranking
County: Morris Health Behaviors Ranking
1
(2023)
Compared to:
NJ Counties
The distribution is based on data from 21 New Jersey counties.
County: Morris Morbidity Ranking
County: Morris Morbidity Ranking
1
(2023)
Compared to:
NJ Counties
The distribution is based on data from 21 New Jersey counties.
County: Morris Mortality Ranking
County: Morris Mortality Ranking
3
(2023)
Compared to:
NJ Counties
The distribution is based on data from 21 New Jersey counties.
County: Morris Physical Environment Ranking
County: Morris Physical Environment Ranking
2
(2023)
Compared to:
NJ Counties
The distribution is based on data from 21 New Jersey counties.
County: Morris Social and Economic Factors Ranking
County: Morris Social and Economic Factors Ranking
2
(2023)
Compared to:
NJ Counties
The distribution is based on data from 21 New Jersey counties.
Health / Diabetes
Health / Diabetes
County: Morris
Value
Compared to:
County: Morris Adults 20+ with Diabetes
County: Morris Adults 20+ with Diabetes
6.6%
(2021)
Compared to:
NJ Counties
The distribution is based on data from 21 New Jersey counties.
U.S. Counties
The distribution is based on data from 3,074 U.S. counties and county equivalents.
Prior Value
(6.2%)
Prior Value compares a measured value with the previously measured value. Confidence intervals were taken into account in determining the direction of the comparison.
Trend
This comparison measures the indicator’s values over multiple time periods.<br>The Mann-Kendall Test for Statistical Significance is used to evaluate the trend<br>over 4 to 10 periods of measure, subject to data availability and comparability.
County: Morris Adults with Prediabetes
County: Morris Adults with Prediabetes
6.7%
(2017)
Compared to:
NJ Counties
The distribution is based on data from 21 New Jersey counties.
NJ Value
(9.4%)
The regional value is compared to the New Jersey State value.
Prior Value
(5.3%)
Prior Value compares a measured value with the previously measured value. Confidence intervals were taken into account in determining the direction of the comparison.
Trend
This comparison measures the indicator’s values over multiple time periods.<br>The Mann-Kendall Test for Statistical Significance is used to evaluate the trend<br>over 4 to 10 periods of measure, subject to data availability and comparability.
County: Morris Age-Adjusted Death Rate due to Diabetes
County: Morris Age-Adjusted Death Rate due to Diabetes
16.2
Deaths per 100,000 population
(2019-2021)
Compared to:
NJ Counties
The distribution is based on data from 21 New Jersey counties.
NJ Value
(18.5)
The regional value is compared to the New Jersey State value.
US Value
(24.8 in 2020)
The regional value is compared to the national value. The source for the national value is Centers for Disease Control and Prevention
Prior Value
(14.7)
Prior Value compares a measured value with the previously measured value. Confidence intervals were taken into account in determining the direction of the comparison.
NJ 2020
(15.8)
<div><span>Diabetes is a group of diseases marked by high levels of blood glucose, also called blood sugar, resulting from defects in insulin production, insulin action, or both. In 2007, diabetes was the seventh leading cause of death in the United States and an estimated 23.6 million people or 7.8% of the population had diabetes. The prevalence of diagnosed type 2 diabetes increased sixfold in the latter half of the last century. Diabetes risk factors such as obesity and physical inactivity have played a major role in this dramatic increase. Age, race, and ethnicity are also important risk factors. </span><br /><br /><span>Diabetes can have a harmful effect on most of the organ systems in the human body; it is a frequent cause of end-stage renal disease, non-traumatic lower-extremity amputation, and a leading cause of blindness among working age adults. Persons with diabetes are also at increased risk for ischemic heart disease, neuropathy, and stroke. In economic terms, the direct medical expenditure attributable to diabetes in 2007 was estimated to be $116 billion.</span></div>
County: Morris Diabetes: Medicare Population
County: Morris Diabetes: Medicare Population
24.0%
(2022)
Compared to:
NJ Counties
The distribution is based on data from 21 New Jersey counties.
U.S. Counties
The distribution is based on data from 3,129 U.S. counties and county equivalents.
NJ Value
(28.0%)
The regional value is compared to the New Jersey State value.
US Value
(24.0%)
The regional value is compared to the national value.
Prior Value
(24.0%)
Prior Value compares a measured value with the previously measured value. Confidence intervals were not taken into account in determining the direction of the comparison.
Trend
This comparison measures the indicator’s values over multiple time periods.<br>The Mann-Kendall Test for Statistical Significance is used to evaluate the trend<br>over 4 to 10 periods of measure, subject to data availability and comparability.
County: Morris Diabetic Monitoring: Medicare Population
County: Morris Diabetic Monitoring: Medicare Population
88.2%
(2019)
Compared to:
NJ Counties
The distribution is based on data from 21 New Jersey counties.
U.S. Counties
The distribution is based on data from 3,097 U.S. counties and county equivalents.
NJ Value
(87.6%)
The regional value is compared to the New Jersey State value.
US Value
(87.5%)
The regional value is compared to the national value.
Prior Value
(88.3%)
Prior Value compares a measured value with the previously measured value. Confidence intervals were taken into account in determining the direction of the comparison.
Trend
This comparison measures the indicator’s values over multiple time periods.<br>The Mann-Kendall Test for Statistical Significance is used to evaluate the trend<br>over 4 to 10 periods of measure, subject to data availability and comparability.
Health / Disabilities
Health / Disabilities
County: Morris
Value
Compared to:
County: Morris Adults with Disability Living in Poverty
County: Morris Adults with Disability Living in Poverty
12.0%
(2018-2022)
Compared to:
NJ Counties
The distribution is based on data from 21 New Jersey counties.
U.S. Counties
The distribution is based on data from 3,132 U.S. counties and county equivalents.
NJ Value
(20.3%)
The regional value is compared to the New Jersey State value.
US Value
(24.9%)
The regional value is compared to the national value.
Trend
This comparison measures the indicator’s values over multiple time periods.<br>The Mann-Kendall Test for Statistical Significance is used to evaluate the trend<br>over 4 to 10 periods of measure, subject to data availability and comparability.
County: Morris Children with a Disability
County: Morris Children with a Disability
2.7%
(2018-2022)
Compared to:


NJ Value
(3.6%)
The regional value is compared to the New Jersey State value.
US Value
(4.5%)
The regional value is compared to the national value.
Trend
This comparison measures the indicator’s values over multiple time periods.<br>The Mann-Kendall Test for Statistical Significance is used to evaluate the trend<br>over 4 to 10 periods of measure, subject to data availability and comparability.
County: Morris Persons with a Cognitive Difficulty
County: Morris Persons with a Cognitive Difficulty
3.4%
(2018-2022)
Compared to:
NJ Value
(4.1%)
The regional value is compared to the New Jersey State value.
US Value
(5.3%)
The regional value is compared to the national value.
Trend
This comparison measures the indicator’s values over multiple time periods.<br>The Mann-Kendall Test for Statistical Significance is used to evaluate the trend<br>over 4 to 10 periods of measure, subject to data availability and comparability.
County: Morris Persons with a Disability
County: Morris Persons with a Disability
8.9%
(2018-2022)
Compared to:
NJ Value
(10.6%)
The regional value is compared to the New Jersey State value.
US Value
(12.9%)
The regional value is compared to the national value.
Trend
This comparison measures the indicator’s values over multiple time periods.<br>The Mann-Kendall Test for Statistical Significance is used to evaluate the trend<br>over 4 to 10 periods of measure, subject to data availability and comparability.
County: Morris Persons with a Hearing Difficulty
County: Morris Persons with a Hearing Difficulty
2.6%
(2018-2022)
Compared to:

NJ Value
(2.6%)
The regional value is compared to the New Jersey State value.
US Value
(3.6%)
The regional value is compared to the national value.
Trend
This comparison measures the indicator’s values over multiple time periods.<br>The Mann-Kendall Test for Statistical Significance is used to evaluate the trend<br>over 4 to 10 periods of measure, subject to data availability and comparability.
County: Morris Persons with a Self-Care Difficulty
County: Morris Persons with a Self-Care Difficulty
1.9%
(2018-2022)
Compared to:
NJ Value
(2.4%)
The regional value is compared to the New Jersey State value.
US Value
(2.6%)
The regional value is compared to the national value.
Trend
This comparison measures the indicator’s values over multiple time periods.<br>The Mann-Kendall Test for Statistical Significance is used to evaluate the trend<br>over 4 to 10 periods of measure, subject to data availability and comparability.
County: Morris Persons with a Vision Difficulty
County: Morris Persons with a Vision Difficulty
1.4%
(2018-2022)
Compared to:
NJ Value
(2.0%)
The regional value is compared to the New Jersey State value.
US Value
(2.4%)
The regional value is compared to the national value.
Trend
This comparison measures the indicator’s values over multiple time periods.<br>The Mann-Kendall Test for Statistical Significance is used to evaluate the trend<br>over 4 to 10 periods of measure, subject to data availability and comparability.
County: Morris Persons with an Ambulatory Difficulty
County: Morris Persons with an Ambulatory Difficulty
4.3%
(2018-2022)
Compared to:

NJ Value
(5.7%)
The regional value is compared to the New Jersey State value.
US Value
(6.7%)
The regional value is compared to the national value.
Trend
This comparison measures the indicator’s values over multiple time periods.<br>The Mann-Kendall Test for Statistical Significance is used to evaluate the trend<br>over 4 to 10 periods of measure, subject to data availability and comparability.
County: Morris Veterans with a Disability
County: Morris Veterans with a Disability
28.7%
(2018-2022)
Compared to:

NJ Value
(28.3%)
The regional value is compared to the New Jersey State value.
US Value
(29.8%)
The regional value is compared to the national value.
Trend
This comparison measures the indicator’s values over multiple time periods.<br>The Mann-Kendall Test for Statistical Significance is used to evaluate the trend<br>over 4 to 10 periods of measure, subject to data availability and comparability.
Health / Family Planning
Health / Family Planning
County: Morris
Value
Compared to:
County: Morris Teen Birth Rate: 15-17
County: Morris Teen Birth Rate: 15-17
2.4
Live births per 1,000 females aged 15-17
(2010)
Compared to:
NJ Value
(10.0)
The regional value is compared to the New Jersey State value.
US Value
(17.3)
The regional value is compared to the national value. The source for the national value is Centers for Disease Control and Prevention, National Center for Health Statistics
Prior Value
(2.4)
Prior Value compares a measured value with the previously measured value. Confidence intervals were taken into account in determining the direction of the comparison.
Health / Health Care Access & Quality
Health / Health Care Access & Quality
County: Morris
Value
Compared to:
County: Morris Adults Unable to Afford to See a Doctor
County: Morris Adults Unable to Afford to See a Doctor
6.9%
(2021)
Compared to:
NJ Counties
The distribution is based on data from 21 New Jersey counties.
NJ Value
(9.7%)
The regional value is compared to the New Jersey State value.
US Value
(8.7%)
The regional value is compared to the national value. The source for the national value is Behavioral Risk Factor Surveillance System
Prior Value
(5.9%)
Prior Value compares a measured value with the previously measured value. Confidence intervals were taken into account in determining the direction of the comparison.
Trend
This comparison measures the indicator’s values over multiple time periods.<br>The Mann-Kendall Test for Statistical Significance is used to evaluate the trend<br>over 4 to 10 periods of measure, subject to data availability and comparability.
County: Morris Adults who enrolled in the health insurance marketplace
County: Morris Adults who enrolled in the health insurance marketplace
16,482.0
(2017)
Compared to:
NJ Value
(14,051)
The regional value is compared to the average county value.
Prior Value
(4,239.0)
Prior Value compares a measured value with the previously measured value. Confidence intervals were not taken into account in determining the direction of the comparison.
County: Morris Adults who have had a Routine Checkup
County: Morris Adults who have had a Routine Checkup
68.7%
(2021)
Compared to:
NJ Counties
The distribution is based on data from 21 New Jersey counties.
NJ Value
(74.8%)
The regional value is compared to the New Jersey State value.
Prior Value
(72.0%)
Prior Value compares a measured value with the previously measured value. Confidence intervals were taken into account in determining the direction of the comparison.
Trend
This comparison measures the indicator’s values over multiple time periods.<br>The Mann-Kendall Test for Statistical Significance is used to evaluate the trend<br>over 4 to 10 periods of measure, subject to data availability and comparability.
County: Morris Adults with at least one primary care provider
County: Morris Adults with at least one primary care provider
16.1%
Percentage
(2016)
Compared to:

NJ Value
(19.4%)
The regional value is compared to the county value.
Prior Value
(85.9%)
Prior Value compares a measured value with the previously measured value. Confidence intervals were not taken into account in determining the direction of the comparison.
County: Morris Adults with Health Insurance
County: Morris Adults with Health Insurance
94.5%
(2022)
Compared to:
NJ Counties
The distribution is based on data from 21 New Jersey counties.
U.S. Counties
The distribution is based on data from 828 U.S. counties and county equivalents.
NJ Value
(90.4%)
The regional value is compared to the New Jersey State value.
US Value
(88.7%)
The regional value is compared to the national value.
Prior Value
(93.4%)
Prior Value compares a measured value with the previously measured value. Confidence intervals were taken into account in determining the direction of the comparison.
Trend
This comparison measures the indicator’s values over multiple time periods.<br>The Mann-Kendall Test for Statistical Significance is used to evaluate the trend<br>over 4 to 10 periods of measure, subject to data availability and comparability.
County: Morris Adults without Health Insurance
County: Morris Adults without Health Insurance
5.2%
(2022)
Compared to:
NJ Counties
The distribution is based on data from 21 New Jersey counties.
U.S. Counties
The distribution is based on data from 3,133 U.S. counties and county equivalents.
US Value
(10.8%)
The regional value is compared to the national value.
County: Morris Children with Health Insurance
County: Morris Children with Health Insurance
97.5%
(2022)
Compared to:
NJ Counties
The distribution is based on data from 21 New Jersey counties.
U.S. Counties
The distribution is based on data from 828 U.S. counties and county equivalents.
NJ Value
(96.1%)
The regional value is compared to the New Jersey State value.
US Value
(94.9%)
The regional value is compared to the national value.
Prior Value
(96.3%)
Prior Value compares a measured value with the previously measured value. Confidence intervals were taken into account in determining the direction of the comparison.
Trend
This comparison measures the indicator’s values over multiple time periods.<br>The Mann-Kendall Test for Statistical Significance is used to evaluate the trend<br>over 4 to 10 periods of measure, subject to data availability and comparability.
County: Morris Medicare Healthcare Costs
County: Morris Medicare Healthcare Costs
$9,610
Dollars per enrollee
(2015)
Compared to:

NJ Value
($10,211)
The regional value is compared to the New Jersey State value.
US Value
($9,729)
The regional value is compared to the national value.
Prior Value
($9,586)
Prior Value compares a measured value with the previously measured value. Confidence intervals were not taken into account in determining the direction of the comparison.
Trend
This comparison measures the indicator’s values over multiple time periods.<br>The Mann-Kendall Test for Statistical Significance is used to evaluate the trend<br>over 4 to 10 periods of measure, subject to data availability and comparability.
County: Morris Non-Physician Primary Care Provider Rate
County: Morris Non-Physician Primary Care Provider Rate
102
Providers per 100,000 population
(2023)
Compared to:
NJ Counties
The distribution is based on data from 21 New Jersey counties.
U.S. Counties
The distribution is based on data from 3,129 U.S. counties and county equivalents.
NJ Value
(84)
The regional value is compared to the New Jersey State value.
Prior Value
(94)
Prior Value compares a measured value with the previously measured value. Confidence intervals were not taken into account in determining the direction of the comparison.
Trend
This comparison measures the indicator’s values over multiple time periods.<br>The Mann-Kendall Test for Statistical Significance is used to evaluate the trend<br>over 4 to 10 periods of measure, subject to data availability and comparability.
County: Morris Persons with Health Insurance
County: Morris Persons with Health Insurance
94.7%
(2022)
Compared to:
NJ Counties
The distribution is based on data from 21 New Jersey counties.
U.S. Counties
The distribution is based on data from 3,132 U.S. counties and county equivalents.
NJ Value
(92.0%)
The regional value is compared to the New Jersey State value.
Prior Value
(94.4%)
Prior Value compares a measured value with the previously measured value. Confidence intervals were taken into account in determining the direction of the comparison.
Trend
This comparison measures the indicator’s values over multiple time periods.<br>The Mann-Kendall Test for Statistical Significance is used to evaluate the trend<br>over 4 to 10 periods of measure, subject to data availability and comparability.
HP 2030 Target
(92.4%)
<div>AHS-01: Increase the proportion of people with health insurance <strong>(LEADING HEALTH INDICATOR)</strong></div>
County: Morris Persons with Private Health Insurance Only
County: Morris Persons with Private Health Insurance Only
71.2%
(2022)
Compared to:
NJ Value
(59.6%)
The regional value is compared to the New Jersey State value.
US Value
(54.8%)
The regional value is compared to the national value.
Prior Value
(70.9%)
Prior Value compares a measured value with the previously measured value. Confidence intervals were not taken into account in determining the direction of the comparison.
Trend
This comparison measures the indicator’s values over multiple time periods.<br>The Mann-Kendall Test for Statistical Significance is used to evaluate the trend<br>over 4 to 10 periods of measure, subject to data availability and comparability.
County: Morris Persons with Public Health Insurance Only
County: Morris Persons with Public Health Insurance Only
12.0%
(2022)
Compared to:

NJ Value
(21.9%)
The regional value is compared to the New Jersey State value.
US Value
(24.8%)
The regional value is compared to the national value.
Prior Value
(12.7%)
Prior Value compares a measured value with the previously measured value. Confidence intervals were not taken into account in determining the direction of the comparison.
Trend
This comparison measures the indicator’s values over multiple time periods.<br>The Mann-Kendall Test for Statistical Significance is used to evaluate the trend<br>over 4 to 10 periods of measure, subject to data availability and comparability.
County: Morris Preventable Hospital Stays: Medicare Population
County: Morris Preventable Hospital Stays: Medicare Population
2,208
Discharges per 100,000 Medicare enrollees
(2022)
Compared to:
NJ Counties
The distribution is based on data from 21 New Jersey counties.
U.S. Counties
The distribution is based on data from 3,129 U.S. counties and county equivalents.
NJ Value
(2,986)
The regional value is compared to the New Jersey State value.
US Value
(2,677)
The regional value is compared to the national value.
Prior Value
(2,166)
Prior Value compares a measured value with the previously measured value. Confidence intervals were not taken into account in determining the direction of the comparison.
Trend
This comparison measures the indicator’s values over multiple time periods.<br>The Mann-Kendall Test for Statistical Significance is used to evaluate the trend<br>over 4 to 10 periods of measure, subject to data availability and comparability.
County: Morris Primary Care Provider Rate
County: Morris Primary Care Provider Rate
93
Providers per 100,000 population
(2021)
Compared to:
NJ Counties
The distribution is based on data from 21 New Jersey counties.
U.S. Counties
The distribution is based on data from 2,984 U.S. counties and county equivalents.
NJ Value
(78)
The regional value is compared to the New Jersey State value.
Prior Value
(101)
Prior Value compares a measured value with the previously measured value. Confidence intervals were not taken into account in determining the direction of the comparison.
Trend
This comparison measures the indicator’s values over multiple time periods.<br>The Mann-Kendall Test for Statistical Significance is used to evaluate the trend<br>over 4 to 10 periods of measure, subject to data availability and comparability.
Health / Health Information Technology
Health / Health Information Technology
County: Morris
Value
Compared to:
County: Morris Households with an Internet Subscription
County: Morris Households with an Internet Subscription
94.1%
(2018-2022)
Compared to:
NJ Counties
The distribution is based on data from 21 New Jersey counties.
U.S. Counties
The distribution is based on data from 3,133 U.S. counties and county equivalents.
NJ Value
(90.7%)
The regional value is compared to the New Jersey State value.
US Value
(88.5%)
The regional value is compared to the national value.
Trend
This comparison measures the indicator’s values over multiple time periods.<br>The Mann-Kendall Test for Statistical Significance is used to evaluate the trend<br>over 4 to 10 periods of measure, subject to data availability and comparability.
County: Morris Households with One or More Types of Computing Devices
County: Morris Households with One or More Types of Computing Devices
96.1%
(2018-2022)
Compared to:
NJ Counties
The distribution is based on data from 21 New Jersey counties.
U.S. Counties
The distribution is based on data from 3,133 U.S. counties and county equivalents.
NJ Value
(94.5%)
The regional value is compared to the New Jersey State value.
US Value
(94.0%)
The regional value is compared to the national value.
Trend
This comparison measures the indicator’s values over multiple time periods.<br>The Mann-Kendall Test for Statistical Significance is used to evaluate the trend<br>over 4 to 10 periods of measure, subject to data availability and comparability.
County: Morris Persons with an Internet Subscription
County: Morris Persons with an Internet Subscription
96.1%
(2018-2022)
Compared to:
NJ Counties
The distribution is based on data from 21 New Jersey counties.
U.S. Counties
The distribution is based on data from 3,133 U.S. counties and county equivalents.
NJ Value
(92.8%)
The regional value is compared to the New Jersey State value.
US Value
(91.0%)
The regional value is compared to the national value.
Trend
This comparison measures the indicator’s values over multiple time periods.<br>The Mann-Kendall Test for Statistical Significance is used to evaluate the trend<br>over 4 to 10 periods of measure, subject to data availability and comparability.
Health / Heart Disease & Stroke
Health / Heart Disease & Stroke
County: Morris
Value
Compared to:
County: Morris Adults who Experienced a Heart Attack
County: Morris Adults who Experienced a Heart Attack
4.6%
(2021)
Compared to:
NJ Counties
The distribution is based on data from 20 New Jersey counties.
NJ Value
(3.0%)
The regional value is compared to the New Jersey State value.
Prior Value
(4.4%)
Prior Value compares a measured value with the previously measured value. Confidence intervals were taken into account in determining the direction of the comparison.
Trend
This comparison measures the indicator’s values over multiple time periods.<br>The Mann-Kendall Test for Statistical Significance is used to evaluate the trend<br>over 4 to 10 periods of measure, subject to data availability and comparability.
County: Morris Adults who Experienced a Stroke
County: Morris Adults who Experienced a Stroke
2.6%
(2021)
Compared to:
NJ Counties
The distribution is based on data from 21 New Jersey counties.
NJ Value
(2.4%)
The regional value is compared to the New Jersey State value.
Prior Value
(2.2%)
Prior Value compares a measured value with the previously measured value. Confidence intervals were taken into account in determining the direction of the comparison.
Trend
This comparison measures the indicator’s values over multiple time periods.<br>The Mann-Kendall Test for Statistical Significance is used to evaluate the trend<br>over 4 to 10 periods of measure, subject to data availability and comparability.
County: Morris Adults who Experienced Coronary Heart Disease
County: Morris Adults who Experienced Coronary Heart Disease
1.1%
(2021)
Compared to:
NJ Counties
The distribution is based on data from 21 New Jersey counties.
NJ Value
(2.9%)
The regional value is compared to the New Jersey State value.
Prior Value
(2.3%)
Prior Value compares a measured value with the previously measured value. Confidence intervals were taken into account in determining the direction of the comparison.
Trend
This comparison measures the indicator’s values over multiple time periods.<br>The Mann-Kendall Test for Statistical Significance is used to evaluate the trend<br>over 4 to 10 periods of measure, subject to data availability and comparability.
County: Morris Adults who Have Taken Medications for High Blood Pressure
County: Morris Adults who Have Taken Medications for High Blood Pressure
77.9%
(2021)
Compared to:
NJ Counties
The distribution is based on data from 21 New Jersey counties.
U.S. Counties
The distribution is based on data from 3,066 U.S. counties and county equivalents.
US Value
(78.2%)
The regional value is compared to the national value.
28.4
Deaths per 100,000 population
(2019-2021)
Compared to:
NJ Counties
The distribution is based on data from 21 New Jersey counties.
NJ Value
(31.6)
The regional value is compared to the New Jersey State value.
US Value
(38.8 in 2020)
The regional value is compared to the national value. The source for the national value is Centers for Disease Control and Prevention
Prior Value
(28.1)
Prior Value compares a measured value with the previously measured value. Confidence intervals were taken into account in determining the direction of the comparison.
HP 2030 Target
(33.4)
NJ 2020
(28.6)
<div><span>Cerebrovascular diseases rank third among the leading causes of death in the U.S. Cerebrovascular disease can cause a stroke. A stroke occurs when blood vessels carrying oxygen to the brain become blocked or burst, thereby cutting off the brain's supply of oxygen. Lack of oxygen causes brain cells to die which can lead to death or disability. Each year, approximately 795,000 people in the U.S. will suffer a new or recurrent stroke. Although people of all ages may have strokes, the risk more than doubles with each decade of life after age 55. The most important modifiable risk factors for stroke are high blood pressure, high cholesterol and diabetes mellitus.</span></div>
County: Morris Age-Adjusted Death Rate due to Heart Attack
County: Morris Age-Adjusted Death Rate due to Heart Attack
42.8
Deaths per 100,000 population 35+ years
(2021)
Compared to:
NJ Counties
The distribution is based on data from 21 New Jersey counties.
U.S. Counties
The distribution is based on data from 3,101 U.S. counties and county equivalents.
NJ Value
(41.1)
The regional value is compared to the New Jersey State value.
Prior Value
(54.2)
Prior Value compares a measured value with the previously measured value. Confidence intervals were not taken into account in determining the direction of the comparison.
Trend
This comparison measures the indicator’s values over multiple time periods.<br>The Mann-Kendall Test for Statistical Significance is used to evaluate the trend<br>over 4 to 10 periods of measure, subject to data availability and comparability.
County: Morris Age-Adjusted Death Rate due to Heart Disease
County: Morris Age-Adjusted Death Rate due to Heart Disease
135.3
Deaths per 100,000 population
(2019-2021)
Compared to:
NJ Counties
The distribution is based on data from 21 New Jersey counties.
NJ Value
(161.4)
The regional value is compared to the New Jersey State value.
Prior Value
(141.9)
Prior Value compares a measured value with the previously measured value. Confidence intervals were taken into account in determining the direction of the comparison.
NJ 2020
(112.1)
<div>
<div>Heart disease is a term that encompasses a variety of different diseases affecting the heart and is the leading cause of death in the United States accounting for 25.4% of total deaths. The most common type in the United States is coronary artery disease, which can cause heart attack, angina, heart failure, and arrhythmias. Coronary artery disease occurs when plaque builds up in the arteries that supply blood to the heart and the arteries narrow (atherosclerosis). There are many modifiable risk factors for atherosclerosis including tobacco smoking, obesity, sedentary lifestyle, and high levels of low-density lipoprotein in blood serum. Moreover, it is important to note that heart disease is the number one killer of women in the United States.</div>
<div> </div>
</div>
County: Morris Age-Adjusted Death Rate due to Hypertensive Heart Disease
County: Morris Age-Adjusted Death Rate due to Hypertensive Heart Disease
9.7
Deaths per 100,000 population
(2019-2021)
Compared to:
NJ Counties
The distribution is based on data from 21 New Jersey counties.
NJ Value
(9.7)
The regional value is compared to the New Jersey State value.
Prior Value
(9.4)
Prior Value compares a measured value with the previously measured value. Confidence intervals were taken into account in determining the direction of the comparison.
County: Morris Age-Adjusted Hospitalization Rate due to Heart Attack
County: Morris Age-Adjusted Hospitalization Rate due to Heart Attack
19.0
Hospitalizations per 10,000 population 35+ years
(2022)
Compared to:
NJ Counties
The distribution is based on data from 21 New Jersey counties.
NJ Value
(23.3)
The regional value is compared to the New Jersey State value.
Prior Value
(20.9)
Prior Value compares a measured value with the previously measured value. Confidence intervals were not taken into account in determining the direction of the comparison.
Trend
This comparison measures the indicator’s values over multiple time periods.<br>The Mann-Kendall Test for Statistical Significance is used to evaluate the trend<br>over 4 to 10 periods of measure, subject to data availability and comparability.
County: Morris Atrial Fibrillation: Medicare Population
County: Morris Atrial Fibrillation: Medicare Population
15.0%
(2022)
Compared to:
NJ Counties
The distribution is based on data from 21 New Jersey counties.
U.S. Counties
The distribution is based on data from 3,129 U.S. counties and county equivalents.
NJ Value
(15.0%)
The regional value is compared to the New Jersey State value.
US Value
(14.0%)
The regional value is compared to the national value.
Prior Value
(14.0%)
Prior Value compares a measured value with the previously measured value. Confidence intervals were not taken into account in determining the direction of the comparison.
Trend
This comparison measures the indicator’s values over multiple time periods.<br>The Mann-Kendall Test for Statistical Significance is used to evaluate the trend<br>over 4 to 10 periods of measure, subject to data availability and comparability.
County: Morris Cholesterol Test History
County: Morris Cholesterol Test History
90.1%
(2021)
Compared to:
NJ Counties
The distribution is based on data from 21 New Jersey counties.
U.S. Counties
The distribution is based on data from 3,066 U.S. counties and county equivalents.
US Value
(86.4%)
The regional value is compared to the national value.
County: Morris Heart Failure: Medicare Population
County: Morris Heart Failure: Medicare Population
11.0%
(2022)
Compared to:
NJ Counties
The distribution is based on data from 21 New Jersey counties.
U.S. Counties
The distribution is based on data from 3,129 U.S. counties and county equivalents.
NJ Value
(12.0%)
The regional value is compared to the New Jersey State value.
US Value
(11.0%)
The regional value is compared to the national value.
Prior Value
(10.0%)
Prior Value compares a measured value with the previously measured value. Confidence intervals were not taken into account in determining the direction of the comparison.
Trend
This comparison measures the indicator’s values over multiple time periods.<br>The Mann-Kendall Test for Statistical Significance is used to evaluate the trend<br>over 4 to 10 periods of measure, subject to data availability and comparability.
County: Morris High Blood Pressure Prevalence
County: Morris High Blood Pressure Prevalence
29.9%
(2021)
Compared to:
NJ Counties
The distribution is based on data from 21 New Jersey counties.
U.S. Counties
The distribution is based on data from 3,066 U.S. counties and county equivalents.
US Value
(32.7%)
The regional value is compared to the national value.
HP 2030 Target
(41.9%)
County: Morris High Cholesterol Prevalence
County: Morris High Cholesterol Prevalence
34.6%
(2021)
Compared to:
NJ Counties
The distribution is based on data from 21 New Jersey counties.
U.S. Counties
The distribution is based on data from 3,066 U.S. counties and county equivalents.
US Value
(35.5%)
The regional value is compared to the national value.
County: Morris High Cholesterol Prevalence: Past 5 Years
County: Morris High Cholesterol Prevalence: Past 5 Years
33.3%
(2017)
Compared to:
NJ Counties
The distribution is based on data from 21 New Jersey counties.
U.S. Counties
The distribution is based on data from 3,142 U.S. counties and county equivalents.
US Value
(34.1%)
The regional value is compared to the national value.
County: Morris Hyperlipidemia: Medicare Population
County: Morris Hyperlipidemia: Medicare Population
73.0%
(2022)
Compared to:
NJ Counties
The distribution is based on data from 21 New Jersey counties.
U.S. Counties
The distribution is based on data from 3,129 U.S. counties and county equivalents.
NJ Value
(73.0%)
The regional value is compared to the New Jersey State value.
US Value
(65.0%)
The regional value is compared to the national value.
Prior Value
(70.0%)
Prior Value compares a measured value with the previously measured value. Confidence intervals were not taken into account in determining the direction of the comparison.
Trend
This comparison measures the indicator’s values over multiple time periods.<br>The Mann-Kendall Test for Statistical Significance is used to evaluate the trend<br>over 4 to 10 periods of measure, subject to data availability and comparability.
County: Morris Hypertension: Medicare Population
County: Morris Hypertension: Medicare Population
68.0%
(2022)
Compared to:
NJ Counties
The distribution is based on data from 21 New Jersey counties.
U.S. Counties
The distribution is based on data from 3,129 U.S. counties and county equivalents.
NJ Value
(69.0%)
The regional value is compared to the New Jersey State value.
US Value
(65.0%)
The regional value is compared to the national value.
Prior Value
(67.0%)
Prior Value compares a measured value with the previously measured value. Confidence intervals were not taken into account in determining the direction of the comparison.
Trend
This comparison measures the indicator’s values over multiple time periods.<br>The Mann-Kendall Test for Statistical Significance is used to evaluate the trend<br>over 4 to 10 periods of measure, subject to data availability and comparability.
County: Morris Ischemic Heart Disease: Medicare Population
County: Morris Ischemic Heart Disease: Medicare Population
24.0%
(2022)
Compared to:
NJ Counties
The distribution is based on data from 21 New Jersey counties.
U.S. Counties
The distribution is based on data from 3,129 U.S. counties and county equivalents.
NJ Value
(25.0%)
The regional value is compared to the New Jersey State value.
US Value
(21.0%)
The regional value is compared to the national value.
Prior Value
(23.0%)
Prior Value compares a measured value with the previously measured value. Confidence intervals were not taken into account in determining the direction of the comparison.
Trend
This comparison measures the indicator’s values over multiple time periods.<br>The Mann-Kendall Test for Statistical Significance is used to evaluate the trend<br>over 4 to 10 periods of measure, subject to data availability and comparability.
County: Morris Stroke: Medicare Population
County: Morris Stroke: Medicare Population
6.0%
(2022)
Compared to:
NJ Counties
The distribution is based on data from 21 New Jersey counties.
U.S. Counties
The distribution is based on data from 3,129 U.S. counties and county equivalents.
NJ Value
(7.0%)
The regional value is compared to the New Jersey State value.
US Value
(6.0%)
The regional value is compared to the national value.
Prior Value
(6.0%)
Prior Value compares a measured value with the previously measured value. Confidence intervals were not taken into account in determining the direction of the comparison.
Trend
This comparison measures the indicator’s values over multiple time periods.<br>The Mann-Kendall Test for Statistical Significance is used to evaluate the trend<br>over 4 to 10 periods of measure, subject to data availability and comparability.
Health / Immunizations & Infectious Diseases
Health / Immunizations & Infectious Diseases
County: Morris
Value
Compared to:
County: Morris Adults 50+ with Influenza Vaccination
County: Morris Adults 50+ with Influenza Vaccination
69.9%
(2021)
Compared to:
NJ Counties
The distribution is based on data from 20 New Jersey counties.
NJ Value
(57.8%)
The regional value is compared to the New Jersey State value.
Prior Value
(58.6%)
Prior Value compares a measured value with the previously measured value. Confidence intervals were taken into account in determining the direction of the comparison.
Trend
This comparison measures the indicator’s values over multiple time periods.<br>The Mann-Kendall Test for Statistical Significance is used to evaluate the trend<br>over 4 to 10 periods of measure, subject to data availability and comparability.
County: Morris Adults with Pneumonia Vaccination
County: Morris Adults with Pneumonia Vaccination
21.3%
(2021)
Compared to:
NJ Counties
The distribution is based on data from 20 New Jersey counties.
NJ Value
(24.9%)
The regional value is compared to the New Jersey State value.
Prior Value
(22.6%)
Prior Value compares a measured value with the previously measured value. Confidence intervals were taken into account in determining the direction of the comparison.
Trend
This comparison measures the indicator’s values over multiple time periods.<br>The Mann-Kendall Test for Statistical Significance is used to evaluate the trend<br>over 4 to 10 periods of measure, subject to data availability and comparability.
County: Morris Age-Adjusted Death Rate due to Influenza and Pneumonia
County: Morris Age-Adjusted Death Rate due to Influenza and Pneumonia
10.0
Deaths per 100,000 population
(2019-2021)
Compared to:
NJ Counties
The distribution is based on data from 21 New Jersey counties.
NJ Value
(11.7)
The regional value is compared to the New Jersey State value.
US Value
(13.0 in 2020)
The regional value is compared to the national value. The source for the national value is Centers for Disease Control and Prevention
Prior Value
(10.3)
Prior Value compares a measured value with the previously measured value. Confidence intervals were taken into account in determining the direction of the comparison.
County: Morris Age-Adjusted Rate of ED Visits Due to Influenza
County: Morris Age-Adjusted Rate of ED Visits Due to Influenza
13.7
Rate per 10,000 population
(2013)
Compared to:
NJ Value
(20.83)
The regional value is compared to the average rate of all New Jersey Counties.
County: Morris COVID-19 Daily Average Case-Fatality Rate
County: Morris COVID-19 Daily Average Case-Fatality Rate
0.4
Deaths per 100 cases
(Mar 3, 2023)
Compared to:
NJ Counties
The distribution is based on data from 21 New Jersey counties.
U.S. Counties
(Mar 25, 2022)
The distribution is based on data from 2,811 U.S. counties and county equivalents.
NJ Value
(0.7)
The regional value is compared to the New Jersey State value.
US Value
(1.7)
The regional value is compared to the national value.
Prior Value
(0.3)
Prior Value compares a measured value with the previously measured value. Confidence intervals were not taken into account in determining the direction of the comparison.
Trend
This comparison measures the indicator’s values over multiple time periods.<br>The Mann-Kendall Test for Statistical Significance is used to evaluate the trend<br>over 4 to 10 periods of measure, subject to data availability and comparability.
County: Morris COVID-19 Daily Average Incidence Rate
County: Morris COVID-19 Daily Average Incidence Rate
7.33
Cases per 100,000 population
(Mar 3, 2023)
Compared to:
NJ Counties
The distribution is based on data from 21 New Jersey counties.
U.S. Counties
The distribution is based on data from 3,142 U.S. counties and county equivalents.
NJ Value
(9.63)
The regional value is compared to the New Jersey State value.
US Value
(10.97)
The regional value is compared to the national value.
Prior Value
(9.53)
Prior Value compares a measured value with the previously measured value. Confidence intervals were not taken into account in determining the direction of the comparison.
Trend
This comparison measures the indicator’s values over multiple time periods.<br>The Mann-Kendall Test for Statistical Significance is used to evaluate the trend<br>over 4 to 10 periods of measure, subject to data availability and comparability.
County: Morris First Grade Students with Required Immunizations
County: Morris First Grade Students with Required Immunizations
96.5%
(2016)
Compared to:
NJ Value
(92.7%)
The regional value is compared to the New Jersey value.
Prior Value
(98.0%)
Prior Value compares a measured value with the previously measured value. Confidence intervals were not taken into account in determining the direction of the comparison.
County: Morris Flu Vaccinations: Medicare Population
County: Morris Flu Vaccinations: Medicare Population
60.0%
(2022)
Compared to:
NJ Counties
The distribution is based on data from 21 New Jersey counties.
U.S. Counties
The distribution is based on data from 3,129 U.S. counties and county equivalents.
NJ Value
(55.0%)
The regional value is compared to the New Jersey State value.
US Value
(50.0%)
The regional value is compared to the national value.
Prior Value
(60.0%)
Prior Value compares a measured value with the previously measured value. Confidence intervals were not taken into account in determining the direction of the comparison.
Trend
This comparison measures the indicator’s values over multiple time periods.<br>The Mann-Kendall Test for Statistical Significance is used to evaluate the trend<br>over 4 to 10 periods of measure, subject to data availability and comparability.
County: Morris Hepatitis C Cases
County: Morris Hepatitis C Cases
221.0
(2015)
Compared to:
Prior Value
(211.0)
Prior Value compares a measured value with the previously measured value. Confidence intervals were not taken into account in determining the direction of the comparison.
County: Morris Kindergartners with Required Immunizations
County: Morris Kindergartners with Required Immunizations
95.3%
(2022-2023)
Compared to:
NJ Counties
The distribution is based on data from 21 New Jersey counties.
NJ Value
(94.3%)
The regional value is compared to the New Jersey State value.
Prior Value
(95.7%)
Prior Value compares a measured value with the previously measured value. Confidence intervals were not taken into account in determining the direction of the comparison.
Trend
This comparison measures the indicator’s values over multiple time periods.<br>The Mann-Kendall Test for Statistical Significance is used to evaluate the trend<br>over 4 to 10 periods of measure, subject to data availability and comparability.
County: Morris Lyme Disease Cases
County: Morris Lyme Disease Cases
597
Cases
(2022)
Compared to:
Prior Value
(448)
Prior Value compares a measured value with the previously measured value. Confidence intervals were not taken into account in determining the direction of the comparison.
Trend
This comparison measures the indicator’s values over multiple time periods.<br>The Mann-Kendall Test for Statistical Significance is used to evaluate the trend<br>over 4 to 10 periods of measure, subject to data availability and comparability.
County: Morris Persons Fully Vaccinated Against COVID-19
County: Morris Persons Fully Vaccinated Against COVID-19
81.3%
(May 10, 2023)
Compared to:
NJ Counties
The distribution is based on data from 21 New Jersey counties.
U.S. Counties
The distribution is based on data from 3,125 U.S. counties and county equivalents.
Prior Value
(81.3%)
Prior Value compares a measured value with the previously measured value. Confidence intervals were not taken into account in determining the direction of the comparison.
Trend
This comparison measures the indicator’s values over multiple time periods.<br>The Mann-Kendall Test for Statistical Significance is used to evaluate the trend<br>over 4 to 10 periods of measure, subject to data availability and comparability.
County: Morris Pneumonia Vaccinations: Medicare Population
County: Morris Pneumonia Vaccinations: Medicare Population
8.0%
(2022)
Compared to:

NJ Counties
The distribution is based on data from 21 New Jersey counties.
U.S. Counties
The distribution is based on data from 3,129 U.S. counties and county equivalents.
NJ Value
(8.0%)
The regional value is compared to the New Jersey State value.
US Value
(8.0%)
The regional value is compared to the national value.
Prior Value
(7.0%)
Prior Value compares a measured value with the previously measured value. Confidence intervals were not taken into account in determining the direction of the comparison.
Trend
This comparison measures the indicator’s values over multiple time periods.<br>The Mann-Kendall Test for Statistical Significance is used to evaluate the trend<br>over 4 to 10 periods of measure, subject to data availability and comparability.
County: Morris Pre-Kindergarten Students with Required Immunizations
County: Morris Pre-Kindergarten Students with Required Immunizations
94.1%
(2016-2017)
Compared to:
NJ Value
(93.9%)
The regional value is compared to the New Jersey value.
Prior Value
(95.0%)
Prior Value compares a measured value with the previously measured value. Confidence intervals were not taken into account in determining the direction of the comparison.
0.2%
(2016-2017)
Compared to:
NJ Value
(0.2%)
The regional value is compared to the New Jersey average value.
Prior Value
(2.3%)
Prior Value compares a measured value with the previously measured value. Confidence intervals were not taken into account in determining the direction of the comparison.
County: Morris Sixth Grade Students with Required Immunizations
County: Morris Sixth Grade Students with Required Immunizations
97.4%
(2016-2017)
Compared to:
NJ Value
(95.6%)
The regional value is compared to the New Jersey state value.
Prior Value
(93.7%)
Prior Value compares a measured value with the previously measured value. Confidence intervals were not taken into account in determining the direction of the comparison.
County: Morris Transfer Children With Required Immunizations
County: Morris Transfer Children With Required Immunizations
92.1%
(2016-2017)
Compared to:
NJ Value
(90.8%)
The regional value is compared to the New Jersey state value.
Prior Value
(88.5%)
Prior Value compares a measured value with the previously measured value. Confidence intervals were not taken into account in determining the direction of the comparison.
County: Morris Tuberculosis Incidence Rate
County: Morris Tuberculosis Incidence Rate
3.1
Cases per 100,000 population
(2022)
Compared to:
NJ Counties
(2021)
The distribution is based on data from 21 New Jersey counties.
NJ Value
(3.1)
The regional value is compared to the New Jersey State value.
US Value
(2.5)
The regional value is compared to the national value. The source for the national value is Centers for Disease Control and Prevention
Prior Value
(3.6)
Prior Value compares a measured value with the previously measured value. Confidence intervals were not taken into account in determining the direction of the comparison.
Trend
This comparison measures the indicator’s values over multiple time periods.<br>The Mann-Kendall Test for Statistical Significance is used to evaluate the trend<br>over 4 to 10 periods of measure, subject to data availability and comparability.
HP 2030 Target
(1.4)
NJ 2020
(3.5)
<div><span>Tuberculosis (TB) is a bacterial disease that usually affects the lungs, although other parts of the body can also be affected. The TB bacteria are spread through the air when a person with untreated pulmonary TB coughs or sneezes. Prolonged exposure to a person with untreated TB is usually necessary for infection to occur. In 9 out of 10 exposed people, the immune system halts the spread of the infection and the infected person does not become sick or spread disease to others. However, the bacilli remain dormant and can be activated if the immune system becomes severely weakened by HIV, diabetes, chemotherapy cancer treatments, or other causes. A person with TB disease is contagious until he/she has been on appropriate treatment for several days to weeks. The most important way to stop the spread of tuberculosis is for TB patients to cover the mouth and nose when coughing, and to take all TB medicine exactly as prescribed by their physician.</span></div>
Health / Maternal, Fetal & Infant Health
Health / Maternal, Fetal & Infant Health
County: Morris
Value
Compared to:
County: Morris Babies with Low Birthweight
County: Morris Babies with Low Birthweight
5.5%
(2022)
Compared to:
NJ Counties
The distribution is based on data from 21 New Jersey counties.
NJ Value
(7.8%)
The regional value is compared to the New Jersey State value.
US Value
(8.6%)
The regional value is compared to the national value. The source for the national value is Centers for Disease Control and Prevention
Prior Value
(6.7%)
Prior Value compares a measured value with the previously measured value. Confidence intervals were taken into account in determining the direction of the comparison.
Trend
This comparison measures the indicator’s values over multiple time periods.<br>The Mann-Kendall Test for Statistical Significance is used to evaluate the trend<br>over 4 to 10 periods of measure, subject to data availability and comparability.
NJ 2020
(7.7%)
<div><span>Babies born with a low birth weight are more likely than babies of normal weight to require specialized medical care, and often must stay in the intensive care unit. Low birth weight is often associated with premature birth. While there have been many medical advances enabling premature infants to survive, there is still risk of infant death or long-term disability. The most important things an expectant mother can do to prevent prematurity and low birth weight are to take prenatal vitamins, stop smoking, stop drinking alcohol and using drugs, and most importantly, get prenatal care.</span></div>
County: Morris Babies with Very Low Birthweight
County: Morris Babies with Very Low Birthweight
0.6%
(2022)
Compared to:
NJ Counties
The distribution is based on data from 21 New Jersey counties.
NJ Value
(1.2%)
The regional value is compared to the New Jersey State value.
US Value
(1.4% in 2021)
The regional value is compared to the national value. The source for the national value is Centers for Disease Control and Prevention
Prior Value
(0.8%)
Prior Value compares a measured value with the previously measured value. Confidence intervals were taken into account in determining the direction of the comparison.
Trend
This comparison measures the indicator’s values over multiple time periods.<br>The Mann-Kendall Test for Statistical Significance is used to evaluate the trend<br>over 4 to 10 periods of measure, subject to data availability and comparability.
NJ 2020
(1.4%)
<div><span>Babies born with a very low birth weight are more likely than babies of normal weight to require specialized medical care and often must stay in intensive care nurseries. Low birth weight is often associated with premature birth. Babies born at very low birth weight are at the highest risk of dying in their first year. While there have been many medical advances enabling very low birth weight and premature infants to survive, there is still risk of infant death or long-term disability. To prevent prematurity and low birth weight, expectant mothers should take prenatal vitamins, stop smoking, stop drinking alcohol and using drugs, and most importantly, get prenatal care.</span></div>
County: Morris Infant Mortality Rate
County: Morris Infant Mortality Rate
2.6
Deaths per 1,000 live births
(2019-2021)
Compared to:
NJ Value
(4.0)
The regional value is compared to the New Jersey State value.
US Value
(5.4 in 2021)
The regional value is compared to the national value. The source for the national value is Centers for Disease Control and Prevention
Prior Value
(2.9)
Prior Value compares a measured value with the previously measured value. Confidence intervals were taken into account in determining the direction of the comparison.
Trend
This comparison measures the indicator’s values over multiple time periods.<br>The Mann-Kendall Test for Statistical Significance is used to evaluate the trend<br>over 4 to 10 periods of measure, subject to data availability and comparability.
HP 2030 Target
(5.0)
<div>MICH-02: Reduce the rate of infant deaths <strong>(LEADING HEALTH INDICATOR)</strong></div>
NJ 2020
(4.8)
<div><span>Infant mortality rate continues to be one of the most widely used indicators of the overall health status of a community. The leading causes of death among infants are birth defects, pre-term delivery, low birth weight, Sudden Infant Death Syndrome (SIDS), and maternal complications during pregnancy.</span></div>
County: Morris Mothers who Received Early Prenatal Care
County: Morris Mothers who Received Early Prenatal Care
79.4%
(2022)
Compared to:
NJ Counties
(2021)
The distribution is based on data from 21 New Jersey counties.
NJ Value
(72.5%)
The regional value is compared to the New Jersey State value.
US Value
(75.3%)
The regional value is compared to the national value. The source for the national value is Centers for Disease Control and Prevention
Prior Value
(82.6%)
Prior Value compares a measured value with the previously measured value. Confidence intervals were taken into account in determining the direction of the comparison.
Trend
This comparison measures the indicator’s values over multiple time periods.<br>The Mann-Kendall Test for Statistical Significance is used to evaluate the trend<br>over 4 to 10 periods of measure, subject to data availability and comparability.
NJ 2020
(79.4%)
<div><span><span>Babies born to mothers who do not receive prenatal care are three times more likely to have a low birth weight and five times more likely to die than those born to mothers who do get care. Early prenatal care (i.e. care in the first trimester of a pregnancy) allows women and their health care providers to identify and, when possible, treat or correct health problems and health-compromising behaviors that can be particularly damaging during the initial stages of fetal development. Increasing the number of women who receive prenatal care, and who do so early in their pregnancies, can improve birth outcomes and lower health care costs by reducing the likelihood of complications during pregnancy and childbirth.</span></span></div>
County: Morris Mothers who Received No Prenatal Care
County: Morris Mothers who Received No Prenatal Care
0.9%
(2022)
Compared to:
NJ Counties
The distribution is based on data from 21 New Jersey counties.
NJ Value
(1.7%)
The regional value is compared to the New Jersey State value.
US Value
(1.9% in 2020)
The regional value is compared to the national value. The source for the national value is Centers for Disease Control and Prevention
Prior Value
(0.9%)
Prior Value compares a measured value with the previously measured value. Confidence intervals were taken into account in determining the direction of the comparison.
Trend
This comparison measures the indicator’s values over multiple time periods.<br>The Mann-Kendall Test for Statistical Significance is used to evaluate the trend<br>over 4 to 10 periods of measure, subject to data availability and comparability.
County: Morris Preterm Births
County: Morris Preterm Births
7.2%
(2022)
Compared to:
NJ Counties
The distribution is based on data from 21 New Jersey counties.
NJ Value
(9.3%)
The regional value is compared to the New Jersey State value.
US Value
(12.0% in 2020)
The regional value is compared to the national value. The source for the national value is Centers for Disease Control and Prevention
Prior Value
(7.7%)
Prior Value compares a measured value with the previously measured value. Confidence intervals were taken into account in determining the direction of the comparison.
Trend
This comparison measures the indicator’s values over multiple time periods.<br>The Mann-Kendall Test for Statistical Significance is used to evaluate the trend<br>over 4 to 10 periods of measure, subject to data availability and comparability.
HP 2030 Target
(9.4%)
County: Morris Very Preterm Births
County: Morris Very Preterm Births
0.7%
(2022)
Compared to:
NJ Counties
The distribution is based on data from 21 New Jersey counties.
NJ Value
(1.3%)
The regional value is compared to the New Jersey State value.
Prior Value
(1.0%)
Prior Value compares a measured value with the previously measured value. Confidence intervals were taken into account in determining the direction of the comparison.
Trend
This comparison measures the indicator’s values over multiple time periods.<br>The Mann-Kendall Test for Statistical Significance is used to evaluate the trend<br>over 4 to 10 periods of measure, subject to data availability and comparability.
Health / Mental Health & Mental Disorders
Health / Mental Health & Mental Disorders
County: Morris
Value
Compared to:
County: Morris Adults Ever Diagnosed with Depression
County: Morris Adults Ever Diagnosed with Depression
16.0%
(2022)
Compared to:
NJ Counties
The distribution is based on data from 21 New Jersey counties.
U.S. Counties
The distribution is based on data from 3,133 U.S. counties and county equivalents.
US Value
(20.7%)
The regional value is compared to the national value.
County: Morris Age-Adjusted Death Rate due to Suicide
County: Morris Age-Adjusted Death Rate due to Suicide
7.7
Deaths per 100,000 population
(2019-2021)
Compared to:
NJ Counties
The distribution is based on data from 21 New Jersey counties.
NJ Value
(7.3)
The regional value is compared to the New Jersey State value.
US Value
(13.5 in 2020)
The regional value is compared to the national value. The source for the national value is Centers for Disease Control and Prevention
Prior Value
(6.9)
Prior Value compares a measured value with the previously measured value. Confidence intervals were taken into account in determining the direction of the comparison.
HP 2030 Target
(12.8)
<div>MHMD-01: Reduce the suicide rate <strong>(LEADING HEALTH INDICATOR)</strong></div>
NJ 2020
(5.9)
<div><span>Suicide is a major, preventable public health problem. In 2007, suicide was the 11th leading cause of death in the United States. Based on 2007 age-adjusted death rates, men were nearly four times more likely to die of suicide than females, and white individuals were over two times more likely to die of suicide than black or Hispanic individuals. Older Americans are disproportionately likely to die by suicide. An estimated eight to 25 attempted suicides occur for every suicide death.</span></div>
County: Morris Depression: Medicare Population
County: Morris Depression: Medicare Population
16.0%
(2022)
Compared to:
NJ Counties
The distribution is based on data from 21 New Jersey counties.
U.S. Counties
The distribution is based on data from 3,129 U.S. counties and county equivalents.
NJ Value
(15.0%)
The regional value is compared to the New Jersey State value.
US Value
(16.0%)
The regional value is compared to the national value.
Prior Value
(15.0%)
Prior Value compares a measured value with the previously measured value. Confidence intervals were not taken into account in determining the direction of the comparison.
Trend
This comparison measures the indicator’s values over multiple time periods.<br>The Mann-Kendall Test for Statistical Significance is used to evaluate the trend<br>over 4 to 10 periods of measure, subject to data availability and comparability.
County: Morris Frequent Mental Distress
County: Morris Frequent Mental Distress
11.0%
(2018)
Compared to:
NJ Counties
The distribution is based on data from 21 New Jersey counties.
U.S. Counties
The distribution is based on data from 3,142 U.S. counties and county equivalents.
NJ Value
(11.2%)
The regional value is compared to the New Jersey State value.
US Value
(13.0%)
The regional value is compared to the national value.
County: Morris Mental Health Provider Rate
County: Morris Mental Health Provider Rate
331
Providers per 100,000 population
(2023)
Compared to:
NJ Counties
The distribution is based on data from 21 New Jersey counties.
U.S. Counties
The distribution is based on data from 2,956 U.S. counties and county equivalents.
NJ Value
(291)
The regional value is compared to the New Jersey State value.
Prior Value
(310)
Prior Value compares a measured value with the previously measured value. Confidence intervals were not taken into account in determining the direction of the comparison.
Trend
This comparison measures the indicator’s values over multiple time periods.<br>The Mann-Kendall Test for Statistical Significance is used to evaluate the trend<br>over 4 to 10 periods of measure, subject to data availability and comparability.
County: Morris Poor Mental Health: 14+ Days
County: Morris Poor Mental Health: 14+ Days
13.1%
(2022)
Compared to:
NJ Counties
The distribution is based on data from 21 New Jersey counties.
U.S. Counties
The distribution is based on data from 3,133 U.S. counties and county equivalents.
US Value
(15.8%)
The regional value is compared to the national value.
County: Morris Poor Mental Health: Average Number of Days
County: Morris Poor Mental Health: Average Number of Days
4.5
Days
(2021)
Compared to:
NJ Counties
The distribution is based on data from 21 New Jersey counties.
U.S. Counties
The distribution is based on data from 3,141 U.S. counties and county equivalents.
NJ Value
(4.4)
The regional value is compared to the New Jersey State value.
US Value
(4.8)
The regional value is compared to the national value.
Prior Value
(4.0)
Prior Value compares a measured value with the previously measured value. Confidence intervals were taken into account in determining the direction of the comparison.
Health / Mortality Data
Health / Mortality Data
County: Morris
Value
Compared to:
County: Morris Age-Adjusted Death Rate
County: Morris Age-Adjusted Death Rate
636.7
Deaths per 100,000 population
(2019-2021)
Compared to:
NJ Counties
The distribution is based on data from 21 New Jersey counties.
NJ Value
(742.0)
The regional value is compared to the New Jersey State value.
Prior Value
(627.0)
Prior Value compares a measured value with the previously measured value. Confidence intervals were taken into account in determining the direction of the comparison.
County: Morris Life Expectancy
County: Morris Life Expectancy
81.7
Years
(2019-2021)
Compared to:
NJ Counties
The distribution is based on data from 21 New Jersey counties.
U.S. Counties
The distribution is based on data from 3,070 U.S. counties and county equivalents.
NJ Value
(79.2)
The regional value is compared to the New Jersey State value.
US Value
(77.6)
The regional value is compared to the national value.
County: Morris Premature Death
County: Morris Premature Death
4,332.7
Years per 100,000 population
(2019-2021)
Compared to:
NJ Counties
The distribution is based on data from 21 New Jersey counties.
U.S. Counties
The distribution is based on data from 2,886 U.S. counties and county equivalents.
NJ Value
(6,516.3)
The regional value is compared to the New Jersey State value.
US Value
(7,971.5)
The regional value is compared to the national value.
Health / Older Adults
Health / Older Adults
County: Morris
Value
Compared to:
39.9%
(2020)
Compared to:
NJ Counties
The distribution is based on data from 21 New Jersey counties.
U.S. Counties
The distribution is based on data from 3,141 U.S. counties and county equivalents.
US Value
(37.9%)
The regional value is compared to the national value.
41.6%
(2020)
Compared to:
NJ Counties
The distribution is based on data from 21 New Jersey counties.
U.S. Counties
The distribution is based on data from 3,141 U.S. counties and county equivalents.
US Value
(43.7%)
The regional value is compared to the national value.
County: Morris Adults 65+ with a Disability
County: Morris Adults 65+ with a Disability
26.9%
(2018-2022)
Compared to:

NJ Value
(30.0%)
The regional value is compared to the New Jersey State value.
US Value
(33.3%)
The regional value is compared to the national value.
Trend
This comparison measures the indicator’s values over multiple time periods.<br>The Mann-Kendall Test for Statistical Significance is used to evaluate the trend<br>over 4 to 10 periods of measure, subject to data availability and comparability.
County: Morris Adults 65+ with a Hearing Difficulty
County: Morris Adults 65+ with a Hearing Difficulty
10.9%
(2018-2022)
Compared to:
NJ Value
(10.9%)
The regional value is compared to the New Jersey State value.
US Value
(13.7%)
The regional value is compared to the national value.
Trend
This comparison measures the indicator’s values over multiple time periods.<br>The Mann-Kendall Test for Statistical Significance is used to evaluate the trend<br>over 4 to 10 periods of measure, subject to data availability and comparability.
County: Morris Adults 65+ with a Self-Care Difficulty
County: Morris Adults 65+ with a Self-Care Difficulty
6.6%
(2018-2022)
Compared to:
NJ Value
(7.4%)
The regional value is compared to the New Jersey State value.
US Value
(7.4%)
The regional value is compared to the national value.
Trend
This comparison measures the indicator’s values over multiple time periods.<br>The Mann-Kendall Test for Statistical Significance is used to evaluate the trend<br>over 4 to 10 periods of measure, subject to data availability and comparability.
County: Morris Adults 65+ with a Vision Difficulty
County: Morris Adults 65+ with a Vision Difficulty
3.7%
(2018-2022)
Compared to:
NJ Value
(5.2%)
The regional value is compared to the New Jersey State value.
US Value
(6.0%)
The regional value is compared to the national value.
Trend
This comparison measures the indicator’s values over multiple time periods.<br>The Mann-Kendall Test for Statistical Significance is used to evaluate the trend<br>over 4 to 10 periods of measure, subject to data availability and comparability.
County: Morris Adults 65+ with an Independent Living Difficulty
County: Morris Adults 65+ with an Independent Living Difficulty
12.4%
(2018-2022)
Compared to:
NJ Value
(13.3%)
The regional value is compared to the New Jersey State value.
US Value
(13.6%)
The regional value is compared to the national value.
Trend
This comparison measures the indicator’s values over multiple time periods.<br>The Mann-Kendall Test for Statistical Significance is used to evaluate the trend<br>over 4 to 10 periods of measure, subject to data availability and comparability.
County: Morris Adults who were Injured in a Fall: 45+
County: Morris Adults who were Injured in a Fall: 45+
5.5%
(2020)
Compared to:
NJ Counties
The distribution is based on data from 21 New Jersey counties.
NJ Value
(7.1%)
The regional value is compared to the New Jersey State value.
Prior Value
(9.7%)
Prior Value compares a measured value with the previously measured value. Confidence intervals were taken into account in determining the direction of the comparison.
Trend
This comparison measures the indicator’s values over multiple time periods.<br>The Mann-Kendall Test for Statistical Significance is used to evaluate the trend<br>over 4 to 10 periods of measure, subject to data availability and comparability.
County: Morris Age-Adjusted Death Rate due to Alzheimer's Disease
County: Morris Age-Adjusted Death Rate due to Alzheimer's Disease
27.2
Deaths per 100,000 population
(2019-2021)
Compared to:
NJ Counties
The distribution is based on data from 21 New Jersey counties.
NJ Value
(21.8)
The regional value is compared to the New Jersey State value.
US Value
(32.4 in 2020)
The regional value is compared to the national value. The source for the national value is Centers for Disease Control and Prevention
Prior Value
(24.6)
Prior Value compares a measured value with the previously measured value. Confidence intervals were taken into account in determining the direction of the comparison.
County: Morris Alzheimer's Disease or Dementia: Medicare Population
County: Morris Alzheimer's Disease or Dementia: Medicare Population
7.0%
(2022)
Compared to:
NJ Counties
The distribution is based on data from 21 New Jersey counties.
U.S. Counties
(2021)
The distribution is based on data from 3,129 U.S. counties and county equivalents.
NJ Value
(6.0%)
The regional value is compared to the New Jersey State value.
US Value
(6.0%)
The regional value is compared to the national value.
Prior Value
(7.0%)
Prior Value compares a measured value with the previously measured value. Confidence intervals were not taken into account in determining the direction of the comparison.
Trend
This comparison measures the indicator’s values over multiple time periods.<br>The Mann-Kendall Test for Statistical Significance is used to evaluate the trend<br>over 4 to 10 periods of measure, subject to data availability and comparability.
Health / Oral Health
Health / Oral Health
County: Morris
Value
Compared to:
County: Morris Adults 65+ with Total Tooth Loss
County: Morris Adults 65+ with Total Tooth Loss
7.6%
(2022)
Compared to:
NJ Counties
The distribution is based on data from 21 New Jersey counties.
U.S. Counties
The distribution is based on data from 3,133 U.S. counties and county equivalents.
US Value
(12.2%)
The regional value is compared to the national value.
County: Morris Adults who Visited a Dentist
County: Morris Adults who Visited a Dentist
73.4%
(2022)
Compared to:
NJ Counties
The distribution is based on data from 21 New Jersey counties.
U.S. Counties
The distribution is based on data from 3,133 U.S. counties and county equivalents.
US Value
(63.9%)
The regional value is compared to the national value.
County: Morris Dentist Rate
County: Morris Dentist Rate
114
Dentists per 100,000 population
(2022)
Compared to:
NJ Counties
The distribution is based on data from 21 New Jersey counties.
U.S. Counties
The distribution is based on data from 3,054 U.S. counties and county equivalents.
NJ Value
(86)
The regional value is compared to the New Jersey State value.
Prior Value
(115)
Prior Value compares a measured value with the previously measured value. Confidence intervals were not taken into account in determining the direction of the comparison.
Trend
This comparison measures the indicator’s values over multiple time periods.<br>The Mann-Kendall Test for Statistical Significance is used to evaluate the trend<br>over 4 to 10 periods of measure, subject to data availability and comparability.
Health / Other Conditions
Health / Other Conditions
County: Morris
Value
Compared to:
County: Morris Adults with Arthritis
County: Morris Adults with Arthritis
17.9%
(2021)
Compared to:
NJ Counties
The distribution is based on data from 21 New Jersey counties.
NJ Value
(20.1%)
The regional value is compared to the New Jersey State value.
Prior Value
(15.4%)
Prior Value compares a measured value with the previously measured value. Confidence intervals were taken into account in determining the direction of the comparison.
Trend
This comparison measures the indicator’s values over multiple time periods.<br>The Mann-Kendall Test for Statistical Significance is used to evaluate the trend<br>over 4 to 10 periods of measure, subject to data availability and comparability.
County: Morris Adults with Kidney Disease
County: Morris Adults with Kidney Disease
2.7%
(2021)
Compared to:
NJ Counties
The distribution is based on data from 21 New Jersey counties.
U.S. Counties
The distribution is based on data from 3,074 U.S. counties and county equivalents.
US Value
(3.1%)
The regional value is compared to the national value.
County: Morris Age Adjusted Death Rate due to Chronic Kidney Disease
County: Morris Age Adjusted Death Rate due to Chronic Kidney Disease
10.3
(2015)
Compared to:
US Value
(17.5 in 2010)
The regional value is compared to the U.S. median value.
Prior Value
(13.1)
Prior Value compares a measured value with the previously measured value. Confidence intervals were not taken into account in determining the direction of the comparison.
County: Morris Chronic Kidney Disease: Medicare Population
County: Morris Chronic Kidney Disease: Medicare Population
16.0%
(2022)
Compared to:
NJ Counties
The distribution is based on data from 21 New Jersey counties.
U.S. Counties
The distribution is based on data from 3,129 U.S. counties and county equivalents.
NJ Value
(16.0%)
The regional value is compared to the New Jersey State value.
US Value
(18.0%)
The regional value is compared to the national value.
Prior Value
(15.0%)
Prior Value compares a measured value with the previously measured value. Confidence intervals were not taken into account in determining the direction of the comparison.
Trend
This comparison measures the indicator’s values over multiple time periods.<br>The Mann-Kendall Test for Statistical Significance is used to evaluate the trend<br>over 4 to 10 periods of measure, subject to data availability and comparability.
County: Morris Osteoporosis: Medicare Population
County: Morris Osteoporosis: Medicare Population
15.0%
(2022)
Compared to:
NJ Counties
The distribution is based on data from 21 New Jersey counties.
U.S. Counties
The distribution is based on data from 3,129 U.S. counties and county equivalents.
NJ Value
(12.0%)
The regional value is compared to the New Jersey State value.
US Value
(11.0%)
The regional value is compared to the national value.
Prior Value
(14.0%)
Prior Value compares a measured value with the previously measured value. Confidence intervals were not taken into account in determining the direction of the comparison.
Trend
This comparison measures the indicator’s values over multiple time periods.<br>The Mann-Kendall Test for Statistical Significance is used to evaluate the trend<br>over 4 to 10 periods of measure, subject to data availability and comparability.
County: Morris Rheumatoid Arthritis or Osteoarthritis: Medicare Population
County: Morris Rheumatoid Arthritis or Osteoarthritis: Medicare Population
35.0%
(2022)
Compared to:
NJ Counties
The distribution is based on data from 21 New Jersey counties.
U.S. Counties
The distribution is based on data from 3,129 U.S. counties and county equivalents.
NJ Value
(37.0%)
The regional value is compared to the New Jersey State value.
US Value
(35.0%)
The regional value is compared to the national value.
Prior Value
(33.0%)
Prior Value compares a measured value with the previously measured value. Confidence intervals were not taken into account in determining the direction of the comparison.
Trend
This comparison measures the indicator’s values over multiple time periods.<br>The Mann-Kendall Test for Statistical Significance is used to evaluate the trend<br>over 4 to 10 periods of measure, subject to data availability and comparability.
Health / Physical Activity
Health / Physical Activity
County: Morris
Value
Compared to:
County: Morris Adults 20+ who are Sedentary
County: Morris Adults 20+ who are Sedentary
13.5%
(2021)
Compared to:
NJ Counties
The distribution is based on data from 21 New Jersey counties.
U.S. Counties
The distribution is based on data from 3,074 U.S. counties and county equivalents.
Prior Value
(11.9%)
Prior Value compares a measured value with the previously measured value. Confidence intervals were taken into account in determining the direction of the comparison.
Trend
This comparison measures the indicator’s values over multiple time periods.<br>The Mann-Kendall Test for Statistical Significance is used to evaluate the trend<br>over 4 to 10 periods of measure, subject to data availability and comparability.
County: Morris Adults Engaging in Regular Physical Activity
County: Morris Adults Engaging in Regular Physical Activity
60.6%
(2017)
Compared to:
NJ Counties
The distribution is based on data from 21 New Jersey counties.
NJ Value
(49.2%)
The regional value is compared to the New Jersey State value.
US Value
(20.3%)
The regional value is compared to the national value. The source for the national value is Behavioral Risk Factor Surveillance System
Prior Value
(51.0%)
Prior Value compares a measured value with the previously measured value. Confidence intervals were taken into account in determining the direction of the comparison.
Trend
This comparison measures the indicator’s values over multiple time periods.<br>The Mann-Kendall Test for Statistical Significance is used to evaluate the trend<br>over 4 to 10 periods of measure, subject to data availability and comparability.
HP 2030 Target
(29.7%)
<div>PA-05: Increase the proportion of adults who do enough aerobic and muscle-strengthening activity <strong>(LEADING HEALTH INDICATOR)</strong></div>
Health / Prevention & Safety
Health / Prevention & Safety
County: Morris
Value
Compared to:
County: Morris Age-Adjusted Death Rate due to Firearms
County: Morris Age-Adjusted Death Rate due to Firearms
1.7
Deaths per 100,000 population
(2018-2020)
Compared to:
U.S. Counties
The distribution is based on data from 1,083 U.S. counties and county equivalents.
NJ Value
(4.6)
The regional value is compared to the New Jersey State value.
US Value
(12.0)
The regional value is compared to the national value.
Prior Value
(1.8)
Prior Value compares a measured value with the previously measured value. Confidence intervals were taken into account in determining the direction of the comparison.
Trend
This comparison measures the indicator’s values over multiple time periods.<br>The Mann-Kendall Test for Statistical Significance is used to evaluate the trend<br>over 4 to 10 periods of measure, subject to data availability and comparability.
HP 2030 Target
(10.7)
County: Morris Age-Adjusted Death Rate due to Unintentional Injuries
County: Morris Age-Adjusted Death Rate due to Unintentional Injuries
35.7
Deaths per 100,000 population
(2019-2021)
Compared to:
NJ Counties
The distribution is based on data from 21 New Jersey counties.
NJ Value
(50.1)
The regional value is compared to the New Jersey State value.
US Value
(57.6 in 2020)
The regional value is compared to the national value. The source for the national value is Centers for Disease Control and Prevention
Prior Value
(36.0)
Prior Value compares a measured value with the previously measured value. Confidence intervals were taken into account in determining the direction of the comparison.
HP 2030 Target
(43.2)
County: Morris Age-Adjusted Death Rate due to Unintentional Poisonings
County: Morris Age-Adjusted Death Rate due to Unintentional Poisonings
20.2
Deaths per 100,000 population
(2019-2021)
Compared to:
NJ Counties
The distribution is based on data from 21 New Jersey counties.
NJ Value
(31.5)
The regional value is compared to the New Jersey State value.
US Value
(28.3 in 2020)
The regional value is compared to the national value. The source for the national value is Centers for Disease Control and Prevention
Prior Value
(21.0)
Prior Value compares a measured value with the previously measured value. Confidence intervals were taken into account in determining the direction of the comparison.
NJ 2020
(6.8)
